What a Markov Chain Tells You
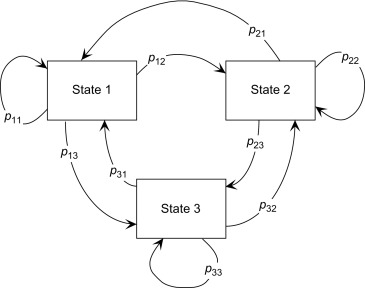
A Markov chain describes a system that moves between states using fixed transition probabilities. The key idea is the Markov property: the next state depends only on the current state, not the full history.
The Formula Used
The calculator uses a row vector convention. If π₀ is the initial probability vector and P is the transition matrix, then:
One step is calculated as:
Transition Matrix Rule
Each row of the transition matrix represents the probabilities of moving from one state to all possible next states. Therefore each row must sum to 1.
| Matrix row | Meaning | Requirement |
|---|---|---|
| Row 1 | Probabilities from State 1 to every next state. | Must sum to 1. |
| Row 2 | Probabilities from State 2 to every next state. | Must sum to 1. |
| Row n | Probabilities from State n to every next state. | Must sum to 1. |
Example: Student Routine
Suppose a student can be in three states:
- S: Studying
- L: Sleeping
- C: Socializing
Transition matrix P:

        S     L     C
S     0.6   0.3   0.1
L     0.2   0.7   0.1
C     0.3   0.3   0.4

Initial vector:
π₀ = [1, 0, 0]
After one step:
π₁ = [1, 0, 0] × P
π₁ = [0.6, 0.3, 0.1]
After two steps:
π₂ = [0.6, 0.3, 0.1] × P
π₂ = [0.45, 0.42, 0.13]
What the Steady-State Estimate Means
Some Markov chains approach a long-run distribution after many steps. This is often called a steady-state distribution. It means the probabilities stop changing much from one step to the next.
Common Mistakes
- Rows of the transition matrix do not sum to 1.
- The initial vector does not sum to 1.
- Mixing row-vector and column-vector conventions.
- Assuming the steady-state estimate exists for every chain.
- Using a fixed matrix when the process actually changes over time.
Frequently Asked Questions
What is a Markov chain?
A Markov chain is a probability model where a system moves between states, and the next state depends only on the current state.
What is a transition matrix?
A transition matrix stores the probability of moving from each current state to each possible next state.
What does the initial state vector mean?
It describes the starting probability of being in each state before transitions begin.
Can this calculator handle Markov decision processes?
No. A Markov decision process includes actions and rewards. This calculator handles basic fixed-transition Markov chains.